TradeStation Charting
YukonSoft >> TradeStation ChartingLearn more about TradeStation Charting
Let’s Talk TradeStation Charting
Talking about TradeStation, we’re basically diving into the nitty-gritty world of trading software. It’s sort of your backstage pass to the stock market, where all the magic (or carnage, depending on the day) happens. The main star of the show? Charting. If you’ve ever looked at a stock chart and felt like you were reading ancient runes, you’re not alone. But once you get the hang of it, it’s like someone handing you the Rosetta Stone.
Kicking Off with TradeStation
TradeStation is a big fish in the trading software pond, offering up some swanky charting tools that traders have come to rely on. So, what exactly makes TradeStation’s charting special? Well, it’s all about customization and clarity. The beauty of TradeStation charting lies in its ability to mold itself to your trading needs like a chameleon trying to blend into a vibrant background.
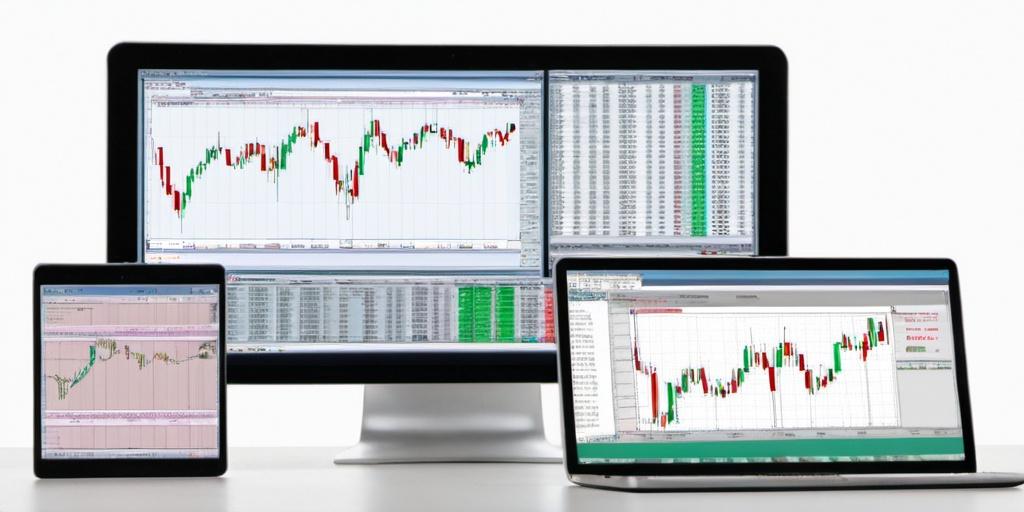
Chart Types and Styles
Think of chart types as different flavors of ice cream. Whether you’re into bar charts, candlestick charts, or line charts, TradeStation’s got it all. Each one has its own quirks and perks, kind of like choosing between chocolate and vanilla. Some traders prefer the classic candlestick pattern because, well, it’s been around for centuries and it’s pretty reliable. Others might opt for line charts, because simplicity is king when raw data is overwhelming.
- Bar Charts: Offers insight into price activity within a specified period. Good if you like things straight to the point.
- Candlestick Charts: Shows price movement and is often considered more aesthetic. The favorite because of its rich information on price action.
- Line Charts: Simplified version showing closing prices. Perfect for a quick overview without the frills.
Technical Indicators: Your Trading Compass
TradeStation allows traders to overlay a slew of technical indicators on their charts. It’s pretty much like having a GPS when you’re utterly lost in the woods. Moving averages, Bollinger Bands, RSI, MACD – if these sound like alphabet soup to you, don’t sweat it. They’re just fancy tools to help traders make sense of where a stock might be headed.
The Ease of Customization
TradeStation’s charting capabilities are like IKEA for data nerds – customizable and sometimes a bit overwhelming. You can tailor your charts as you like, changing time frames, adding custom indicators, or even scripting your own strategies. Imagine having a car where you can swap out the engine, change the tires, and even pick the color of the dashboard. Sounds like fun, right? Well, some might find it daunting, but those who stick with it often find the unrivaled flexibility to be a game-changer.
Trading Strategies on Charts
With TradeStation, you can overlay trading strategies directly onto your charts. It’s kind of like having a cheat sheet during an open-book exam. Whether you’re trading breakouts, trends, or reversals, there’s a way to visualize it. The platform also allows backtesting, so you can play your strategies against historical data. Who wouldn’t want to time travel, even if it’s just to see how your predictions might have fared?
Some Final Thoughts
In the grand scheme of things, TradeStation’s charting abilities offer a detailed and personalized experience for traders who know a thing or two about what they need from their software. It’s powerful, yes, but it’s also like giving a sports car to a teenager – thrilling, perhaps, but it’s best if you know how to handle the power. Anyone who’s dipped their toes in the stock market waters knows that having reliable charting tools is like having a trusty map on a pirate’s quest for treasure. So go on, have a play-around, and maybe, just maybe, you’ll uncover a hidden gem or two.