StockCharts Charting
YukonSoft >> StockCharts ChartingLearn more about StockCharts Charting

What is StockCharts Charting?
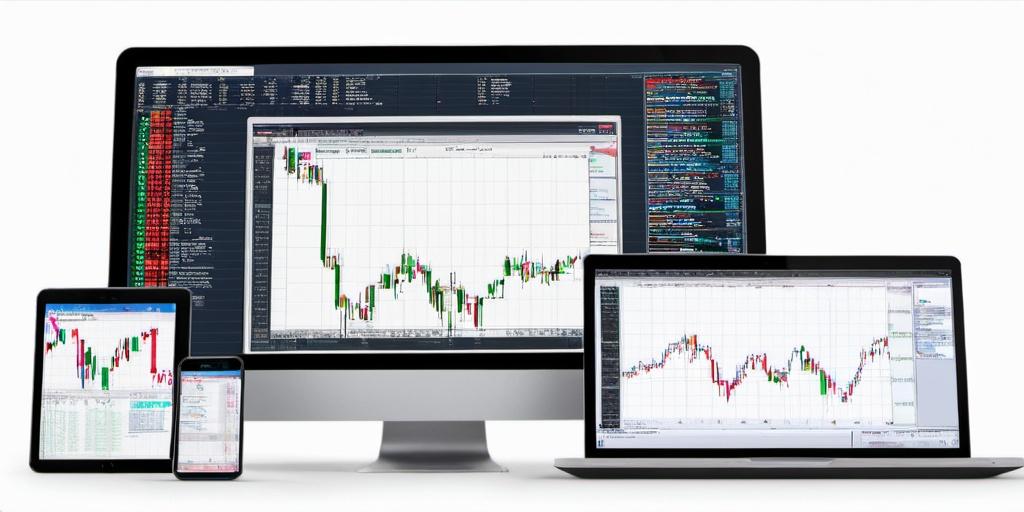
StockCharts Charting is a robust tool for traders and investors wanting to track market trends through well-designed charts. Built primarily for technical analysis, this platform provides an array of charting tools and features that help users make informed decisions. Users can visualize data in multiple formats such as bars, lines, and candlesticks to adapt to different market conditions.
Key Features of StockCharts
This platform boasts several core functionalities that cater to both budding traders and seasoned investors. The intuitive interface is designed for ease, but don’t be fooled, there’s heft under that hood.
Advanced Charting Tools
The advanced charting capabilities of StockCharts allow users to create custom charts using a plethora of technical indicators. These charts can be tailored (well, not tailored in the fancy way) to show different time frames and specific data points. This flexibility is crucial for analyzing short-term fluctuations and long-term trends. Traders can employ features like Point and Figure charts, Renko, Kagi, and more, which might sound like a foreign language but are actually quite helpful.
Technical Indicators
StockCharts provides an extensive list of indicators including Moving Averages, Bollinger Bands, MACD, RSI, and more. These indicators help users to get a closer look at market sentiments and price movements. The platform allows you to overlay these indicators on your charts, offering a blend of data for a consolidated view of market performance. Trying to use them all at once might make your chart look like a Picasso painting, but finding the balance is key.
Customization Options
StockCharts excels in customization, allowing users to tweak chart appearances according to their preferences. Color schemes, grid lines, and annotations can all be adjusted to ensure that your charting environment suits your eyes and trading style. Because no one likes squinting at charts that look more like a Jackson Pollock painting than something useful.
User Experience
The user experience on StockCharts can be likened to driving a sports car on a scenic route. It’s fast, responsive, and provides a clear view of the road ahead. The platform is web-based, which means there’s no need to download or install software, a boon for those with tech-averse tendencies.
Ease of Use
The platform is designed to cater to both beginners and professionals. While newcomers can easily navigate through the basic tools and settings, more experienced traders can delve into advanced features without feeling underwhelmed. It’s a bit like a good book—you can read the summary or dive into every chapter depending on your mood.
Educational Resources
Traders looking to polish their skills or start fresh can benefit from the wide array of educational resources available on the platform. From tutorials and webinars to articles and detailed FAQs, StockCharts provides a helping hand to users at different levels of expertise. It’s like having a coach in your corner, minus the yelling.
Pricing and Accessibility
When it comes to costs, StockCharts offers a subscription model with different pricing tiers to fit various budget levels. Each tier comes with its own set of features and capabilities. The free version provides basic functionalities, which while limited, can still be useful for those starting their charting journey.
Subscription Plans
StockCharts offers several subscription plans, including Basic, Extra, and Pro. Each plan provides different levels of access to features and tools, ensuring there’s something for everyone. For users who want comprehensive analysis tools, the Pro plan offers the most extensive set of features, but all plans provide substantial value based on their price point.
Conclusion
StockCharts is a versatile and reliable tool for those who want their market charts to be as flexible as a gymnast. Its combination of extensive technical indicators, customizable charts, and user-friendly design makes it a standout choice for traders of all experience levels. Whether you’re just dipping your toes in the stock market waters or diving headfirst into complex trading strategies, StockCharts provides everything you need to keep those charts looking crisp and informative.