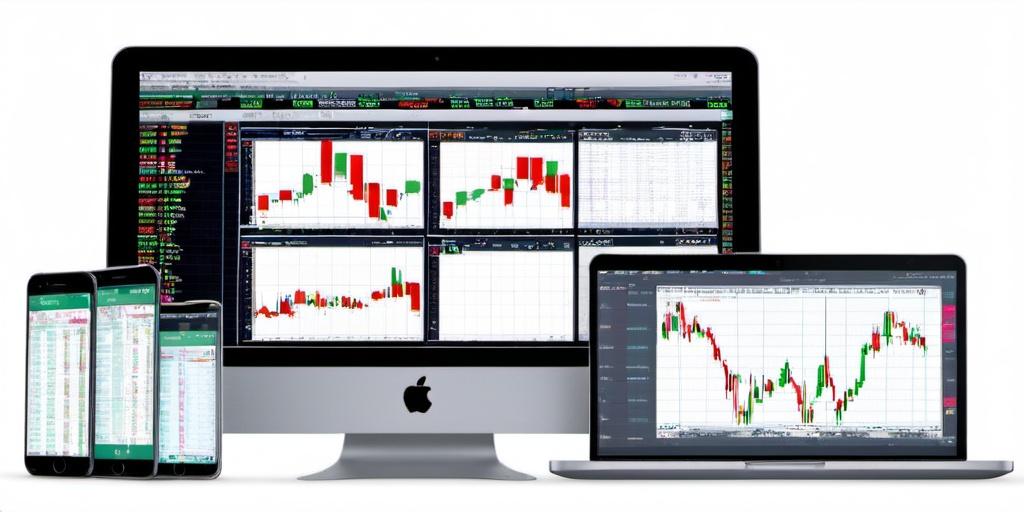
MarketSmith Charting
YukonSoft >> MarketSmith ChartingLearn more about MarketSmith Charting

Overview of MarketSmith Charting
MarketSmith is a recognized name in the trading software arena, providing charting solutions aimed primarily at retail investors. MarketSmith offers comprehensive charting features, but like any tool, it’s not without its quirks and nuances. This write-up digs into what MarketSmith brings to the table, potential pitfalls, and some personal insights from my own bumpy ride using it.
Getting Started with MarketSmith
Starting off with MarketSmith isn’t exactly rocket science. After signing up, you get access to a whole bunch of charts and data. There’s a bit of a learning curve, though. I remember when I first opened it, my eyes glazed over faster than you can say candlestick. But hang in there, a little patience gets you a long way.
The platform primarily focuses on technical analysis and provides tools to assess stock potential. If your interests lean toward fundamental analysis, you might feel a bit left out in the cold. But for those who enjoy a good chart, MarketSmith is virtually a sandbox of trend lines and moving averages.
Features That Stand Out
MarketSmith really shines with its in-depth chart patterns and technical indicators. It’s all very satisfying for anyone who loves a chart with more lines than a geometry textbook.
- Pattern Recognition: Automatic detection of popular chart patterns can save you time, but don’t blindly trust it. It’s like having a friend who insists they’re good at picking stocks—sometimes they’re right, sometimes not.
- Technical Indicators: Chew on a buffet of indicators like moving averages, MACD, and RSI. It’s all there to slice and dice your way through your analysis.
- Growth 250: MarketSmith’s little trove of stocks that show potential growth, based on technical and fundamental analysis. Handy, if you like being part of the stock-picking treasure hunt.
Potential Hiccups
While MarketSmith offers quite a bit, it’s not all sunshine and rainbows. For one thing, it feels a bit like it has a relentless focus on technical analysis, sometimes at the expense of fundamental data. And it could be a tad pricey, especially for newbies who might not want to shell out for every bell and whistle.
The customization can be both a blessing and a curse. It’s flexible, sure, but it can also be overwhelming. I mean, who knew you could have so many different kinds of moving averages?
Personal Experience and Use Cases
I’ve personally used MarketSmith for various trading strategies. It’s been a trusty sidekick when evaluating potential breakouts. The Group Rank feature saved me a few times, like a friend who insists you don’t skimp on dessert, guiding my focus on strong sectors. But I’ve also learned to not rely solely on the automatic pattern recognition—a lesson in the peril of putting all your eggs in one algorithmic basket. Mixed in with other research, though, it’s been handy.
For traders who want to delve further into technical analysis, MarketSmith is worth a gander—though it’s more of a hike than a stroll. Despite its hefty price tag, the platform is worth considering if you’re serious about stock analysis.
Conclusion
In a nutshell, MarketSmith stands tall as a versatile tool for charting and technical analysis. It’s especially suited for the technically inclined trader who values in-depth pattern recognition and indicators. If you’re comfortable navigating its quirks and can justify the cost, it could be a significant asset. Keep your eyes on the charts, a pinch of skepticism about auto-detected patterns, and remember to always conduct your own research.