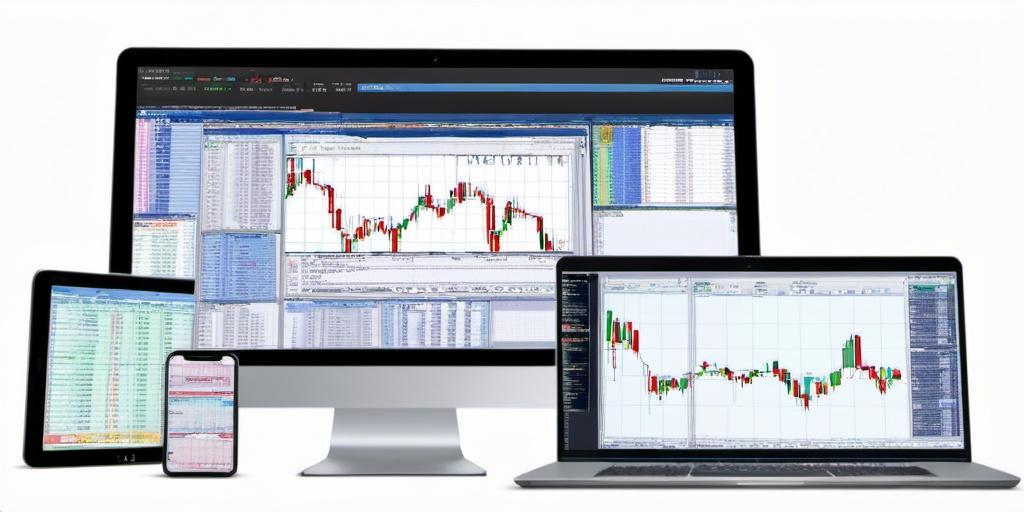
Finviz Charting
YukonSoft >> Finviz ChartingLearn more about Finviz Charting

Introduction to Finviz Charting
The stock market is like a roller coaster ride, filled with ups and downs that can thrill or chill traders in equal measure. For those seeking to decode this excitement, Finviz offers an intriguing prospect. This can be a game-changer for gathering insights into stocks. If you’re not already familiar with it, Finviz stands for Financial Visualizations, and its charting tools are a bit like a pair of glasses that help traders see the market more clearly.
Why Finviz?
Before you shoot off into the stock-picking sunset, it’s worth understanding why Finviz has gained popularity among the trading crowd. In a no-nonsense way, it’s because Finviz is like the Swiss Army knife of financial tools. It’s got a lot of bells and whistles, but does its core job well—providing traders with the ability to see market data visually.
Features of Finviz Charting
Finviz is equipped with a web-based platform that doesn’t require installation, which is nifty if you want something fast and accessible. It serves up a buffet of charts, maps, and screener tools that allow traders to dissect stocks and markets.
– **Technical Indicators:** Whether you’re a fan of Bollinger Bands or Moving Averages, Finviz offers a robust set of technical analysis tools. These indicators can help traders identify trends, momentum, and potential entry or exit points.
– **Heat Maps:** The heat maps are like a bird’s-eye view of the market, showing gainers, losers, and everything in between. It’s a colorful snapshot that can help spot trends across sectors.
– **Screener Tools:** One of the main draws is the screener, which lets you filter stocks based on various indicators. It’s like having a personal assistant that cuts through the clutter.
Using Finviz for Technical Analysis
When it comes to using Finviz for technical analysis, there is a lot that can be explored. Traders often find themselves zooming in on specific patterns like head and shoulders or maybe keeping an eye out for the good ol’ cup and handle. The idea here is simple: use these patterns and visual aids to make more informed trading decisions.
The platform’s charts are responsive and customizable, which means you can tweak them to your liking—something that can be as satisfying as finding the best coffee blend for your morning brew.
Some Tips for Effective Use
– **Fiddle with Filters:** The screener is one of Finviz’s most potent parts. Don’t just glance at it; spend time fiddling with filters. Whether you’re filtering by market cap, industry, or technical indicators, this tool can narrow down choices.
– **Stay Alert with Alerts:** Finviz offers an alert feature that can be your market watchdog. Set it up to notify you when a stock meets specific criteria, so you won’t miss a potential opportunity.
– **Use Backtesting Conservatively:** While Finviz isn’t primarily a backtesting tool, traders sometimes use the charts to visually backtest strategies. Remember, past performance isn’t always an indication of future success.
Limitations
Despite its merits, Finviz isn’t without its quirks. The free version is like a teaser—it offers a lot but keeps some features behind a paywall. Also, while the technical indicators are plenty, traders seeking complex functions might find it limited compared to more sophisticated platforms like Tradestation or ThinkOrSwim.
The Verdict on Finviz Charting
In the grand scheme of stock market tools, Finviz stands out as a practical choice for traders who appreciate slick visuals and usability over complex analytics. It’s not trying to be the fanciest tool on the block; instead, it delivers what many traders need—a straightforward way to visualize data and make informed decisions.
For those who enjoy seeing trends and patterns unfold with a bit of color and flair, Finviz is worth a look. It’s the kind of tool that, once understood, can become a staple in the toolbox of traders looking to navigate the ever-exciting waters of the stock market.