Bloomberg Terminal Charting App
YukonSoft >> Bloomberg Terminal Charting AppLearn more about Bloomberg Terminal Charting App

Understanding the Basics of Bloomberg Terminal’s Charting App
The Bloomberg Terminal, a long-time heavyweight in the financial markets, isn’t just about numbers scrolling across the screen. Its Charting App is a tool that offers a visual feast for those who want more than just numbers. The charts allow traders to visualize market trends, analyze potential outcomes, and make informed decisions with more precision than a dart-throwing monkey.
Historical Context and Evolution
Bloomberg Terminal has been the go-to for financial professionals since the Jurassic period of the financial world. The Charting App, one of its standout features, has evolved alongside it. Originally a simple tool for graphing prices, the app now offers a broadened horizon of chart types, overlays, and indicators. Remember when your old Nokia phone could only send a text? Now think of that compared to today’s smartphones. That’s the leap we’re talking about here.
Main Features and Functionalities
When diving into the Charting App, users are provided with a smorgasbord of features. From your basic line charts to the more advanced candlestick and bar charts, it covers the gamut of visualization tools. Indicators, overlays, and custom technical tools are also at your fingertips, allowing you to tailor charts like a bespoke suit for each financial instrument. The app doesn’t just present data—it tells a story.
Technical Indicators
For the novice or the seasoned pro, technical indicators are the bread and butter. Moving averages, RSI, MACD, and more are just a few of the tools available within the Charting App. These aren’t just buzzwords thrown around at cocktail parties; they’re critical components for identifying trends and making decisions. Consider them your trusty compass in the often tumultuous seas of the market.
Customizable Overlays
Customization is key in today’s fast-paced trading environment. The Bloomberg Terminal Charting App understands this like a chef knowing their salt intake. Users can layer on Bollinger Bands, Fibonacci retracements, or any number of overlays to create a comprehensive analysis of the market. The ability to tweak and adjust according to preference isn’t just an added bonus—it’s a necessity.
Real-Time Data and Alerts
Market shifts don’t send out save-the-dates. The Charting App supplies real-time data, ensuring users have the freshest information at their disposal. Alerts are another invaluable feature, acting like a digital assistant that never sleeps. Alarms can be set for specific price movements, ensuring you’re never caught off guard by market swings.
User Experience and Interface
The interface of the Charting App is a thing of beauty. Smooth, intuitive, and designed with the user in mind, it offers a seamless experience that even a tech-resistant dinosaur could navigate. The learning curve is more like a gentle slope rather than an Everest trek, making it accessible yet powerful.
Practical Use Cases
Imagine you’re a hedge fund manager, juggling multiple positions and pondering which ones to trim. The Charting App’s comparison features allow you to juxtapose various instruments, identifying correlations and divergences. Or perhaps you’re an options trader trying to predict volatility—tools like implied volatility charts become your crystal ball, offering insights into potential market behavior.
Integration and Connectivity
The Bloomberg Terminal isn’t an isolated entity. It’s an interconnected powerhouse. The Charting App integrates seamlessly with other terminal functions, pulling data from news feeds, analytics, and other modules to provide a holistic trading experience. You don’t just look at a chart; you see the bigger picture.
Cross-Platform Compatibility
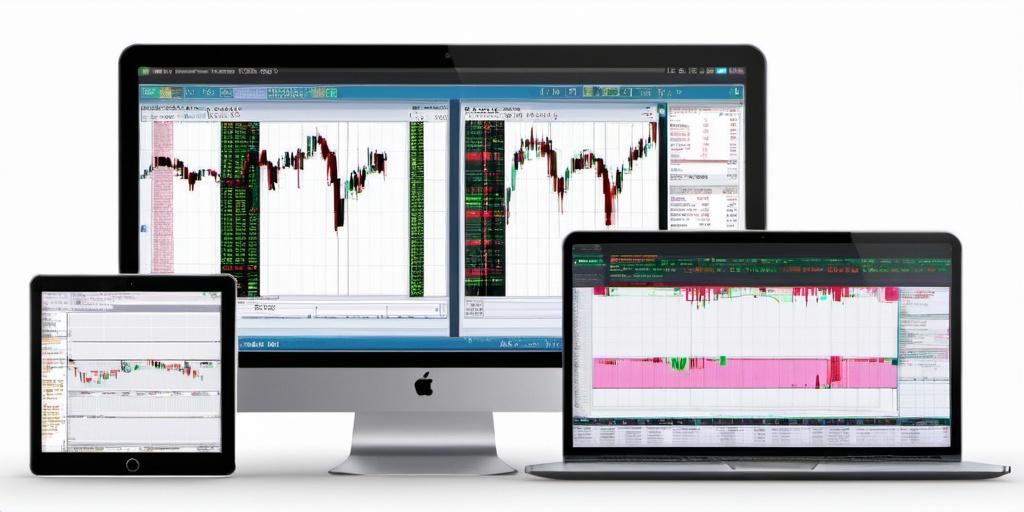
In this age, being tethered to a single device is a relic of the past. The Charting App extends its capabilities across platforms, whether you’re at your desktop, tablet, or smartphone. This accessibility ensures that no opportunity slips through your fingers, regardless of where you are.
Common Challenges and Considerations
Despite its prowess, no tool is without its quirks. Some users find the sheer volume of information overwhelming. It’s easy to get lost in a chart forest when all you need is a single tree. The key is understanding the features relevant to your strategy and resisting the urge to complicate things with every available tool.
Conclusion
The Bloomberg Terminal’s Charting App isn’t just a feature; it’s an ally in the world of trading. From real-time alerts to customizable overlays, it’s equipped to handle the demands of today’s traders. The journey through the charts is akin to a rich narrative unfolding—vivid, dynamic, and yes, profitable for those who master its intricacies.