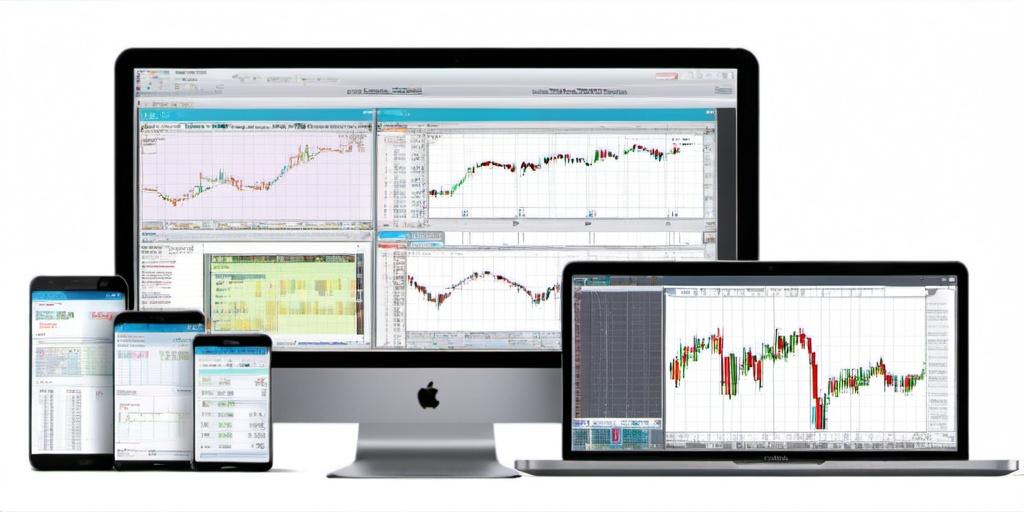
Charting Software
YukonSoft >> Charting SoftwareLearn more about Charting Software

Introduction to Charting Software
Charting software in trading isn’t just there to make everything look pretty. It’s about getting serious with data analysis and decision-making. Imagine sifting through mountains of numbers and finding meaningful patterns – this is what charting platforms help traders do. Now, let’s get into why they’re a big deal and how they can give traders an edge.
Evolution of Charting Software
Back in the day, traders would rely on newspaper charts and manual calculations. Fast forward to now, digital charting platforms provide real-time data, complex indicators, and even predictive analytics. But things weren’t always this smooth. The transition from paper to screen brought hiccups like compatibility issues and clunky interfaces. Early charting software, while groundbreaking at the time, lacked the user-friendliness and features traders expect today. Over the years, as technology evolved, so did the capabilities of charting software, pushing it closer to what we have today.
Features of Modern Charting Software
Today’s charting tools come packed with features that can make a trader feel like a kid in a candy store. You’ve got real-time data updates, customizable charts, and a plethora of technical indicators to choose from. Then there’s the ability to overlay multiple indicators, which lets you dig into what’s happening without needing a dozen eyes. And let’s not forget the integration of social trading, where traders can share and follow strategies, making it a community affair. These platforms also boast tools for backtesting, allowing traders to test their strategies against historical data, providing a sense of security before diving into live trading.
Choosing the Right Software
Picking charting software is like shopping for the right car. It needs to fit your needs, budget, and style. Some traders like simplicity, while others want all the bells and whistles. Factors to consider include:
- User Interface: Is it intuitive or does it make you feel like you’re deciphering hieroglyphics?
- Feature Set: Does it offer the indicators and tools you need?
- Compatibility: Does it sync well with other platforms or your trading strategy?
- Cost: Does it break the bank, or is it reasonable?
Common Softwares in the Market
Several charting platforms have gained popularity among traders, each offering unique features. TradingView, for instance, is known for its wide variety of indicators and a strong community of traders sharing ideas. MetaTrader is favored for forex and CFD trading, providing robust tools and automated trading scripts. ThinkorSwim, from TD Ameritrade, offers advanced analysis tools and is especially popular in the options trading community. Each has its own strengths and weaknesses, making the choice subjective to a trader’s specific needs.
Technical Indicators and Their Use
Technical indicators are like the secret sauce of trading. They help traders make sense of price movements and predict potential trends. Common indicators include Moving Averages, Relative Strength Index (RSI), and MACD. Moving Averages, for example, help in smoothing price data and identifying trends. RSI indicates overbought or oversold conditions, giving traders insights into potential market reversals. While some traders fancy themselves as experts in one or two indicators, mixing them up often gives a better picture, much like adding spices to a dish for that perfect flavor.
The Role of Automation
Automation in charting software isn’t about replacing the human touch but rather complimenting it. Automated tools can scan the markets for trading opportunities based on predefined criteria, saving traders from being glued to their screens 24/7. Imagine sipping coffee while the software does the grunt work. Of course, nothing’s foolproof. Automation can sometimes act like a rebellious teenager, requiring regular monitoring to ensure it stays on track.
Challenges with Charting Software
No technology is without its quirks. Data accuracy is a common issue. A delay of even a second can make the difference between profit and loss. Then there’s the learning curve. Some platforms are as complex as rocket science to newcomers. And let’s not forget cost. Advanced platforms can add a noticeable dent to your budget, which might not sit well if you’re just starting out. Plus, data overload can be a real headache. The sheer volume of available indicators might overwhelm rather than enlighten.
Anecdotes from the Trading Floor
There was this one trader, Rob, who almost switched from trading to becoming a barista because he couldn’t get his head around charting software. Then he stumbled across a platform that clicked. It was simpler, more intuitive, and had a support community that made learning fun rather than a chore. Now, he’s back in the game, making the kind of trades he once only dreamed about. Stories like Rob’s highlight the power of having the right tools at your disposal.
Final Thoughts on Charting Software
Charting platforms have transformed how traders interact with the market, offering tools that are both powerful and, at times, overwhelming. The trick is finding one that complements your trading style and strategies. The right software can be a game-changer, turning data into insights and insights into profits. As with any tool, its effectiveness lies in the hands of its user. A good trader knows when to pull the trigger and when to step back, letting the charts tell the story.