TradingView Analytics
YukonSoft >> TradingView AnalyticsLearn more about TradingView Analytics
Understanding TradingView Analytics
TradingView, a widely used platform by traders and investors, offers a range of analytics tools crucial for making informed trading decisions. And like a dependable compass, it guides traders through the market’s ups and downs, thanks to its vast array of features.
Charting Tools
TradingView is celebrated for its robust charting capabilities. Users can visualize market data through interactive charts. These include bar, candlestick, and line charts. Each type provides unique insights, but candlestick charts are often the go-to for many traders due to their detailed depiction of price movements and patterns.
Moving averages, RSI (Relative Strength Index), MACD (Moving Average Convergence Divergence)—these are terms often thrown around in trader circles, and TradingView has them ready to go. The platform provides an extensive range of indicators that traders can apply to their charts, making the analysis of price trends and potential signals straightforward.
Social and Community Integration
Trading can get lonely, and that’s where TradingView’s community steps in. Users can share charts, scripts, and ideas with others. This feature creates a social hub for traders who wish to engage, discuss strategies, and get feedback from peers. Finding a like-minded trading buddy doesn’t just boost morale; it helps refine strategies too.
Alerts and Automation
Imagine sipping coffee while a gentle nudge alerts you of a price spike, thanks to TradingView’s alert system. These alerts, triggered by custom conditions set by the user, allow traders to stay updated without being glued to the screen. Moreover, TradingView supports Pine Script, enabling users to develop custom scripts and automate strategies.
Market Data and News
An informed trader is a prepared trader. TradingView aggregates news from varied sources and displays them alongside market data. This integration of news with analytics provides users with a comprehensive view, essential for understanding the factors driving market changes. It’s like having the business section of the newspaper right next to your stock chart.
Customizability and User Experience
Whether you’re a minimalist or someone who loves all features front and center, TradingView’s interface caters to all. Users can customize layouts, add or remove tools, and even personalize colors and indicators. This flexibility ensures that each trader’s dashboard is as unique as their trading strategy.
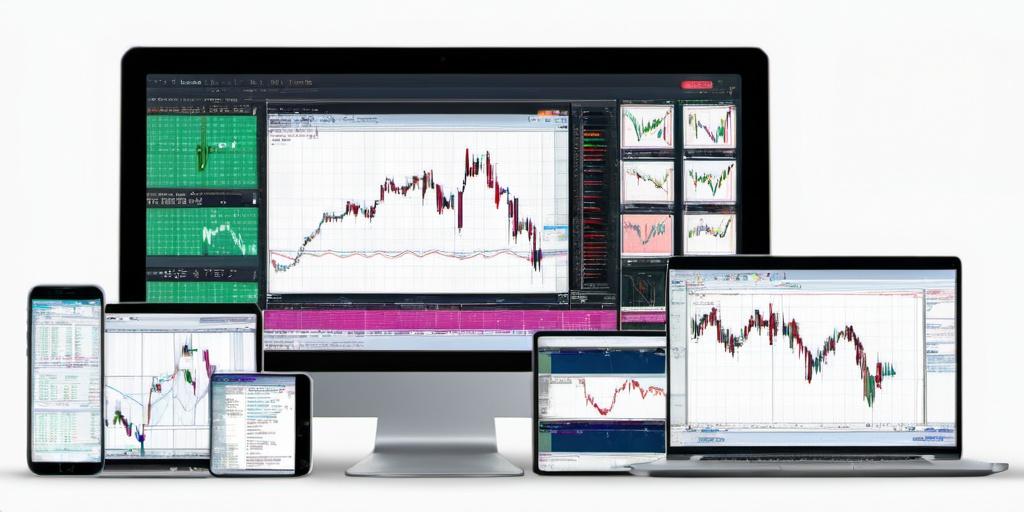
Accessible Across Devices
Traders aren’t always about sitting behind desk; sometimes, they’re on the move. TradingView’s compatibility across devices—whether desktops, tablets, or smartphones—ensures traders remain in the loop wherever they go. This accessibility is invaluable for those spontaneous “aha” moments when a trade idea strikes.
Integrations with Brokers
TradingView doesn’t stand alone; it plays well with others. The platform integrates with a variety of brokers, allowing users to place trades directly from the charts. This integration simplifies the process, bridging analysis with execution seamlessly.
Premium Features and Subscription Plans
While TradingView does offer a free tier, which is feature-rich, there’s always a bit more up its sleeve for those willing to pay. Subscription plans unlock additional alerts, indicators, and enhanced data, catering to both the enthusiastic novice and the seasoned professional.
Conclusion
TradingView’s analytics tools offer comprehensive support to traders, from interactive charts and alerts to social integration and mobile accessibility. Whether navigating through the intricacies of market analysis or engaging with a community of traders, TradingView stands out as a versatile platform. Its blend of analytical tools, social features, and real-time data positions it as a preferred choice for many in the trading world.