TickerChart Charting
YukonSoft >> TickerChart ChartingLearn more about TickerChart Charting
Understanding TickerChart Charting
TickerChart Charting is a software that acts like a one-stop-shop for traders who want to stay on top of market trends. If you’re into turning numbers into insights and insights into smart decisions, you’ve probably heard of it. It’s like your virtual compass navigating the wild seas of trading.
Features of TickerChart Charting
This software isn’t just another pretty interface; it offers a bundle of tools that traders, both new and seasoned, might find useful. The features are designed for deep market analysis, helping users spot patterns, trends, and potential opportunities. Here’s where things get a little spicy—it’s not just for stocks. TickerChart covers everything from stocks to futures, forex, and indices. It’s like an all-you-can-eat buffet for data geeks.
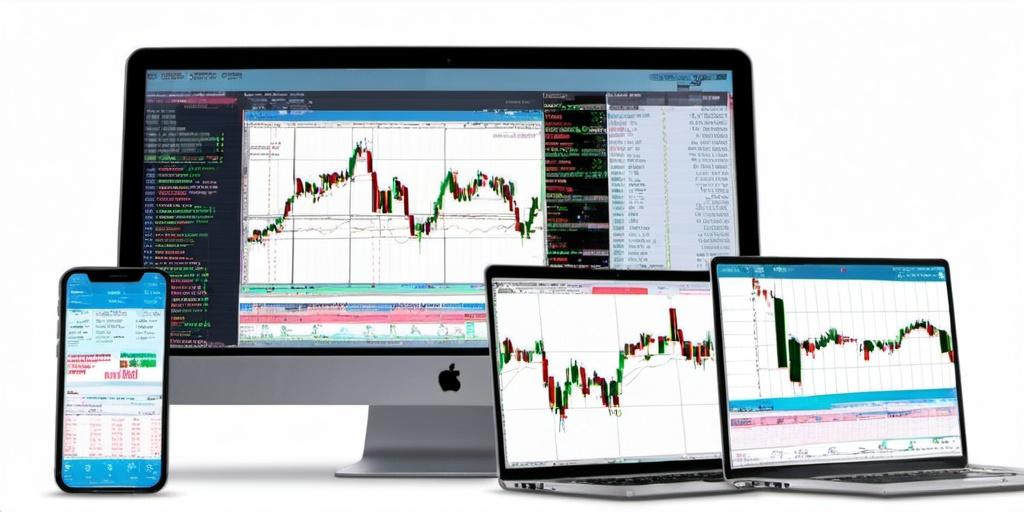
Charting Tools: Folks who live and breathe charts will find a multitude of options here. From line and bar charts to the more intricate candlestick charts, it’s all there. Plus, the technical indicators are plentiful, so you can geek out with tools like Moving Averages, Bollinger Bands, and the like.
Real-Time Data: Real-time data is the name of the game. TickerChart provides instant updates, ensuring you’re not left in the dust while making those split-second decisions. This is especially handy in volatile markets where seconds can mean the difference between profit and loss.
Custom Alerts: You can set alerts that send you running to your trading desk or app, depending on your setup. Think of it as your early morning wake-up call but for stock prices going through the roof, or plummeting.
User Experience
When you’re knee-deep in data, user experience can make or break your day. With TickerChart, you’re not left fumbling through layers of menus just to find the info you want. It’s intuitive enough that even those who aren’t tech-savvy can find their way around after some tinkering. Night owls will be pleased to know that there’s a dark mode, which is easy on the eyes during those late-night trading sessions.
Catering to Different Users
Not all traders are created equal, and TickerChart knows this. It provides tools for various levels of expertise. Whether you’re just starting out or you’ve been trading since the days of the ticker tape, there is something for everyone.
For the rookie trader, there’s access to historical data which can be invaluable. It’s a way to familiarize oneself with market trends without the immediate risk. For the veterans, there’s the capability to dig deep into specifics and strategize with advanced charting tools.
Practical Use Cases
Imagine you’re a trader who loves the rush of forex. You need real-time data, alerts, and a range of charts to keep your trades profitable. With TickerChart, your setups are organized, and your data is updated to the minute. It’s like having your finger on the pulse of your trades at all times.
And for those who prefer a longer-term play, the historical data and custom indicators allow for an analytical approach to trading that takes into account market shifts over time. It’s about making informed decisions based on reliable data.
So, whether you’re a data-cruncher or a tech enthusiast, TickerChart Charting has features that can cater to your trading needs, making your journey—er, path—a tad smoother.
This software won’t suddenly turn you into Warren Buffett, but with the right tools, you’ll be better equipped to make informed decisions. After all, in trading, knowledge isn’t power—it’s profit.