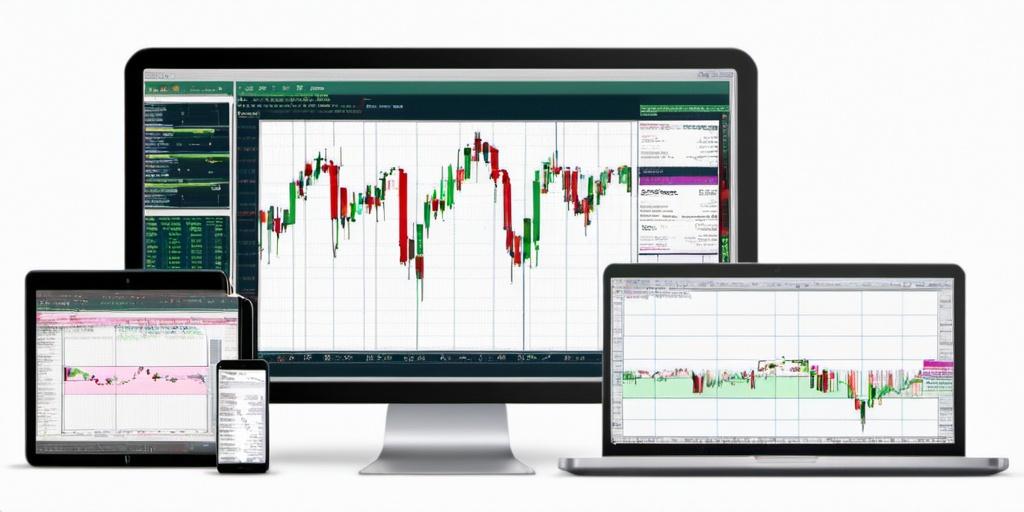
Koyfin Charting
YukonSoft >> Koyfin ChartingLearn more about Koyfin Charting

Understanding Koyfin Charting: What Makes It Stand Out?
Koyfin has been making waves recently with its robust charting capabilities, appealing to both seasoned traders and beginners who prefer a clear and comprehensive view of their investments. The platform’s charting tools are not just visually appealing but are also packed with a range of features that provide insightful data analysis for traders seeking that competitive edge.
What Sets Koyfin Apart?
Koyfin’s charting paves the way for easy visualization of complex data. Investors can access a wealth of information, such as market breadth indicators, technical analysis metrics, and various asset classes displayed in user-friendly charts. As anyone who’s tried to make sense of market data knows, having all of this information in a clear format can be a lifesaver.
Enhanced User Experience
One of the standout features of Koyfin’s charting is its user-centric design. Everything from the color schemes to the layout is designed to make a trader’s life easier. You don’t have to be a tech whiz to navigate these charts—the intuitive design does the heavy lifting.
Customizable Charting Features
Koyfin allows users to customize their charting experience. You can adjust parameters to show exactly what you’re interested in, whether that’s a particular sector, timeframe, or technical indicator. This flexibility means your charts can be as simple or as detailed as you like, focusing only on what matters to you.
Real-Time Market Data
Keeping up-to-date with real-time data can be a game-changer in trading. Koyfin streams real-time data, ensuring you have the latest information at your fingertips. This feature is particularly beneficial for those relying on timely data to make split-second trading decisions.
Integration with Other Platforms
Seamless integration with other platforms is another neat feature of Koyfin. It supports integration with a variety of financial tools and platforms, making it easier to incorporate its data into broader trading strategies. This interoperability is a boon for traders who use multiple tools and need a cohesive experience.
Exploring Use Cases
Let’s not get too carried away with the features—what really matters is how this affects your trading decisions. Imagine a scenario where you’re closely monitoring the tech sector. Koyfin’s charting can provide insights into market trends, helping you gauge your next move. This isn’t just about data; it’s about what you can do with it.
Creating Personal Investment Strategies
By customizing the charts, users can develop personalized investment strategies. Whether you’re focused on long-term investments or a fast-paced trading approach, Koyfin’s tools can help you shape your strategies with precision. It’s like having a tailor-made trading assistant who doesn’t drink your coffee.
Analyzing Historical Data
Ever wish you could rewind and see how specific stocks performed over time? Koyfin lets you do just that. Analyzing historical data can provide valuable insights into market patterns, allowing traders to make more informed decisions about the future.
Balancing Complexity and Simplicity
Some might wonder if all these features make Koyfin complicated to use. The good news is that it strikes a balance. While it offers advanced features for experienced traders, it also provides simplicity for those who prefer straightforward options.
Learning Curve
If you’re a novice, there’s a bit of a learning curve, but it’s not daunting. With a bit of time and a few YouTube tutorials, you’ll be navigating Koyfin like a pro. And if you’re a pro, well, you’re probably already ten steps ahead.
Conclusion
In a world where data is king, having the right tools to interpret that data is crucial. Koyfin’s charting stands out by providing clarity, functionality, and customization to traders. Whether you’re a newbie trying to find your footing, or a seasoned pro seeking fresh insights, Koyfin offers a dynamic charting solution to enhance your trading experience.